Visualize press releases in 3D. VRIFY Signal just launched in beta.

Try It Here

Data Augmentation 101

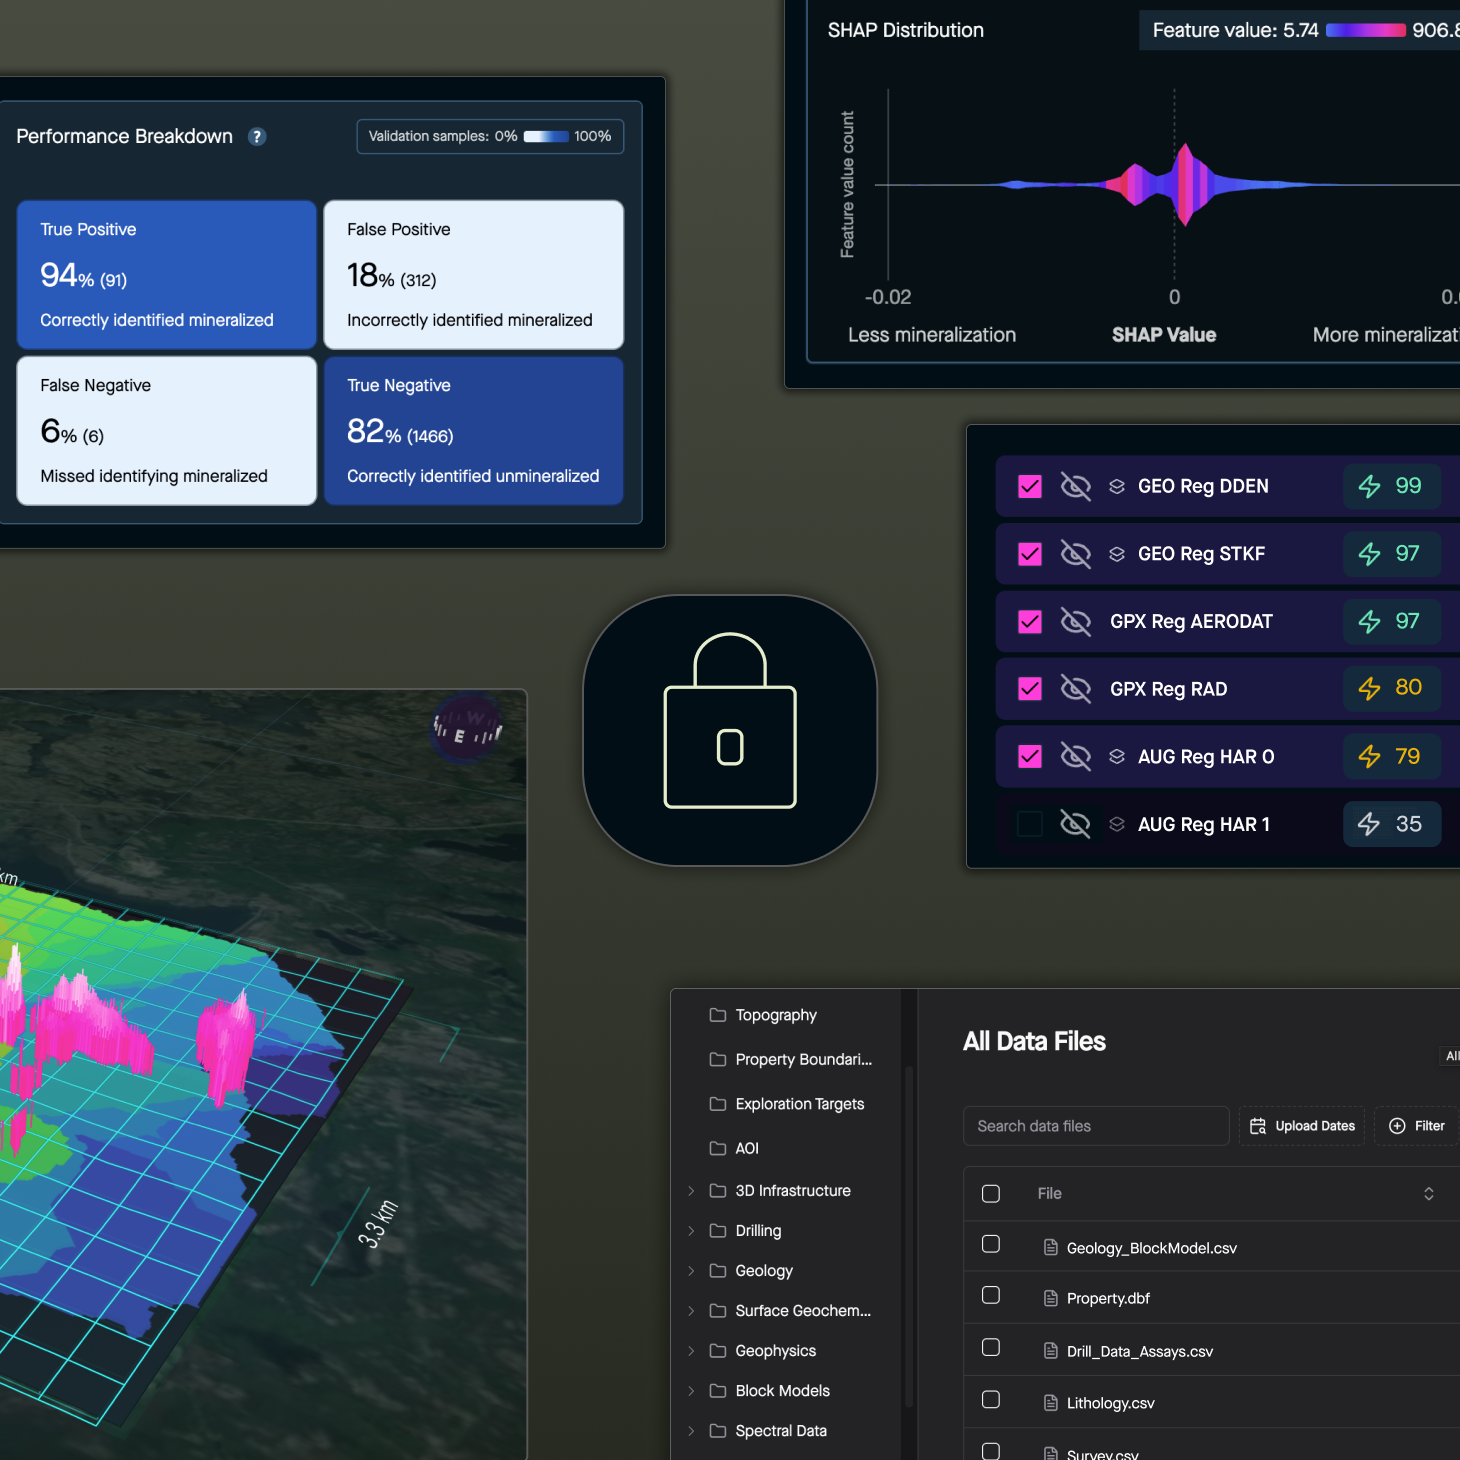
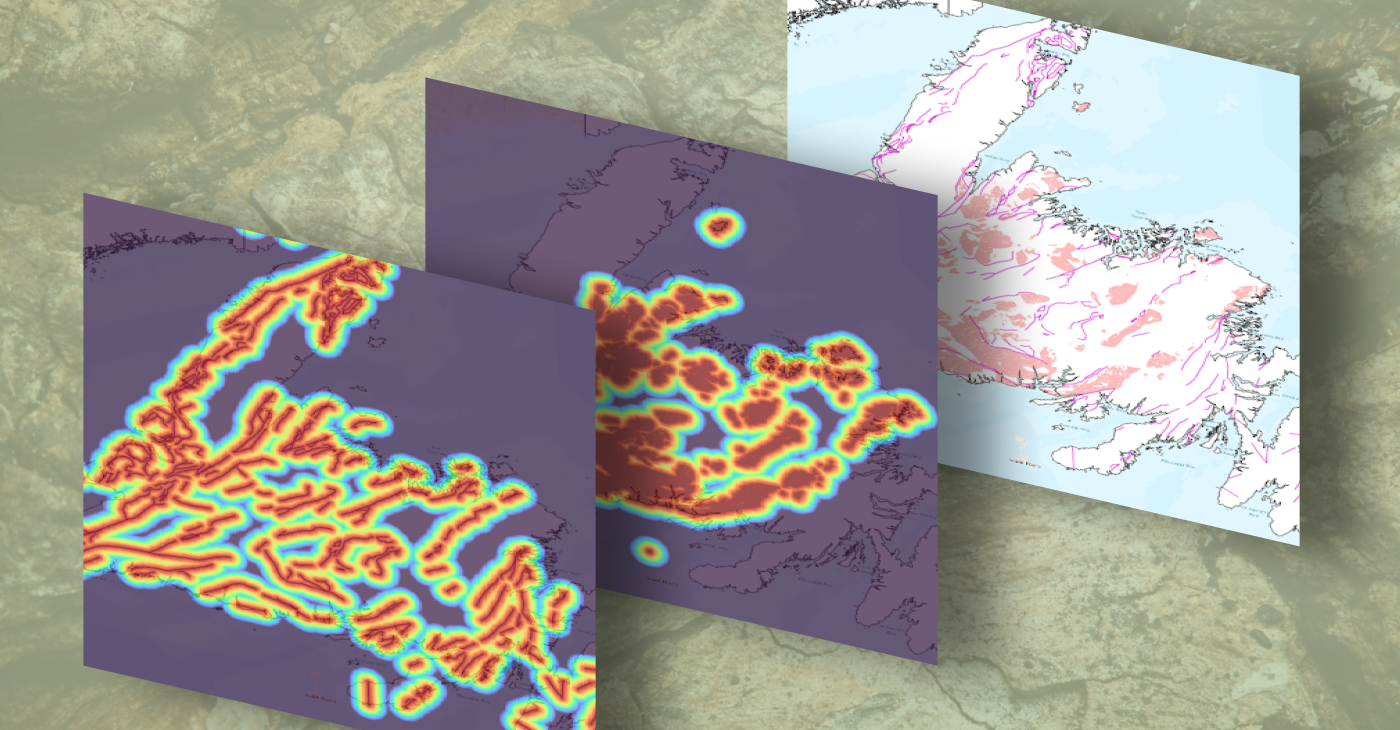
As a core component of DORA, VRIFY’s AI prospectivity mapping software, Data Augmentation prepares exploration data for modelling through format transformation and enhancement, with new layers generated where they expand geological and spatial context.

++
++
Read more

AI-based targeting is becoming a useful addition to mineral exploration workflows, giving geoscientists a systematic way to evaluate complex project information and test geological ideas at scale. For this analysis to be effective, data needs to be prepared to support consistent spatial assessment across the area of interest (AOI).

In DORA, VRIFY’s AI prospectivity mapping software, Data Augmentation is a core data preparation step after standardization and unification are complete. Through a set of proprietary modules, this process supports three main functions: transforming vector inputs into rasters, enhancing signals in existing rasters, and, where appropriate, generating new layers that add geological and spatial context to model development. 

Below is a summary of each function, with examples of specific modules to show how Data Augmentation prepares exploration data for modelling.

Dig further into the full DORA workflow and how its outputs remain interpretable in this article: Transparent AI for Mineral Exploration.

Transforming vectors to rasters

For projects that include vector data, Data Augmentation converts these inputs into rasters DORA can ingest. Structural linework and field measurements for faults, veins, and shear zones are common examples, as are surface geochemical points from rock, soil, till, or lake sediment sampling. 

The gridded output is generated at a resolution guided by input density. Sparse source data produces a coarser grid, while denser coverage can support finer spatial detail.

Once converted, these layers become part of the data stack used for subsequent modelling. Rasterization also provides geoscientists with a continuous spatial representation of the source observations, making relationships between features easier to interpret across the AOI.
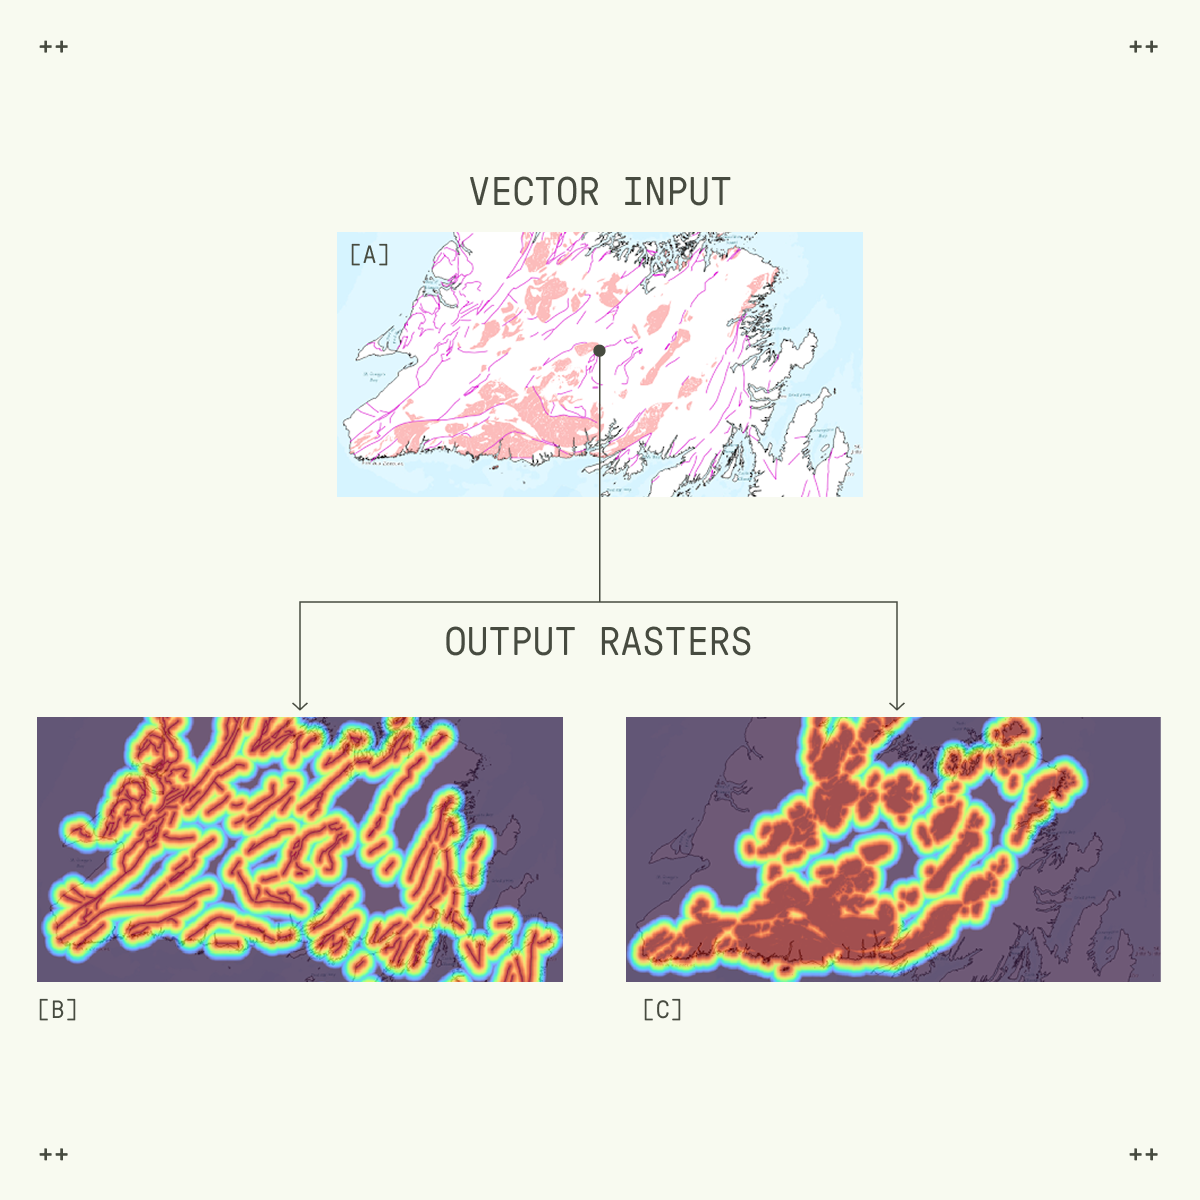
Figure 1.1. Example of converting mapped vector features into distance rasters using the Distance Maps Module. (A) Map of the island of Newfoundland, Canada, showing interpreted 1:1-million scale faults (purple lines) and Devonian-Silurian-aged granitoids (pink polygons) used as vector inputs. (B) Distance raster generated from the regional-scale faults. (C) Distance raster generated from the granitoids. In the visualizations shown here, warmer colours indicate shorter distances to the mapped features, and cooler tones indicate greater distances. Colour ramps can be configured. (Input data source: the Geological Survey Division of the Mining and Mineral Development Branch, Government of Newfoundland and Labrador). The Distance Maps Module quantifies spatial proximity by converting vector features into continuous distance rasters. It accepts polyline and polygon inputs, such as attributed structural traces or favourable lithological units. Each raster cell stores the straight-line Euclidean distance to the nearest selected feature. Processing parameters can be set to the intended scale of analysis, producing distance rasters that can be used to test whether proximity to mapped geological features corresponds with the spatial distribution of mineralization.

Enhancing existing rasters

Some project datasets, like magnetic grids, are already in raster form and can be used for modelling in DORA without conversion. A source raster may carry useful information, but the feature of interest is not always explicit in the measured response. A magnetic response, for example, may reflect alteration corridors, lithological contacts, or faults even when these features are not mapped directly. Data Augmentation processes existing rasters to extract patterns in the measurements. These enhanced rasters can be added as additional input layers alongside the source rasters, giving DORA more information to draw on during modelling.
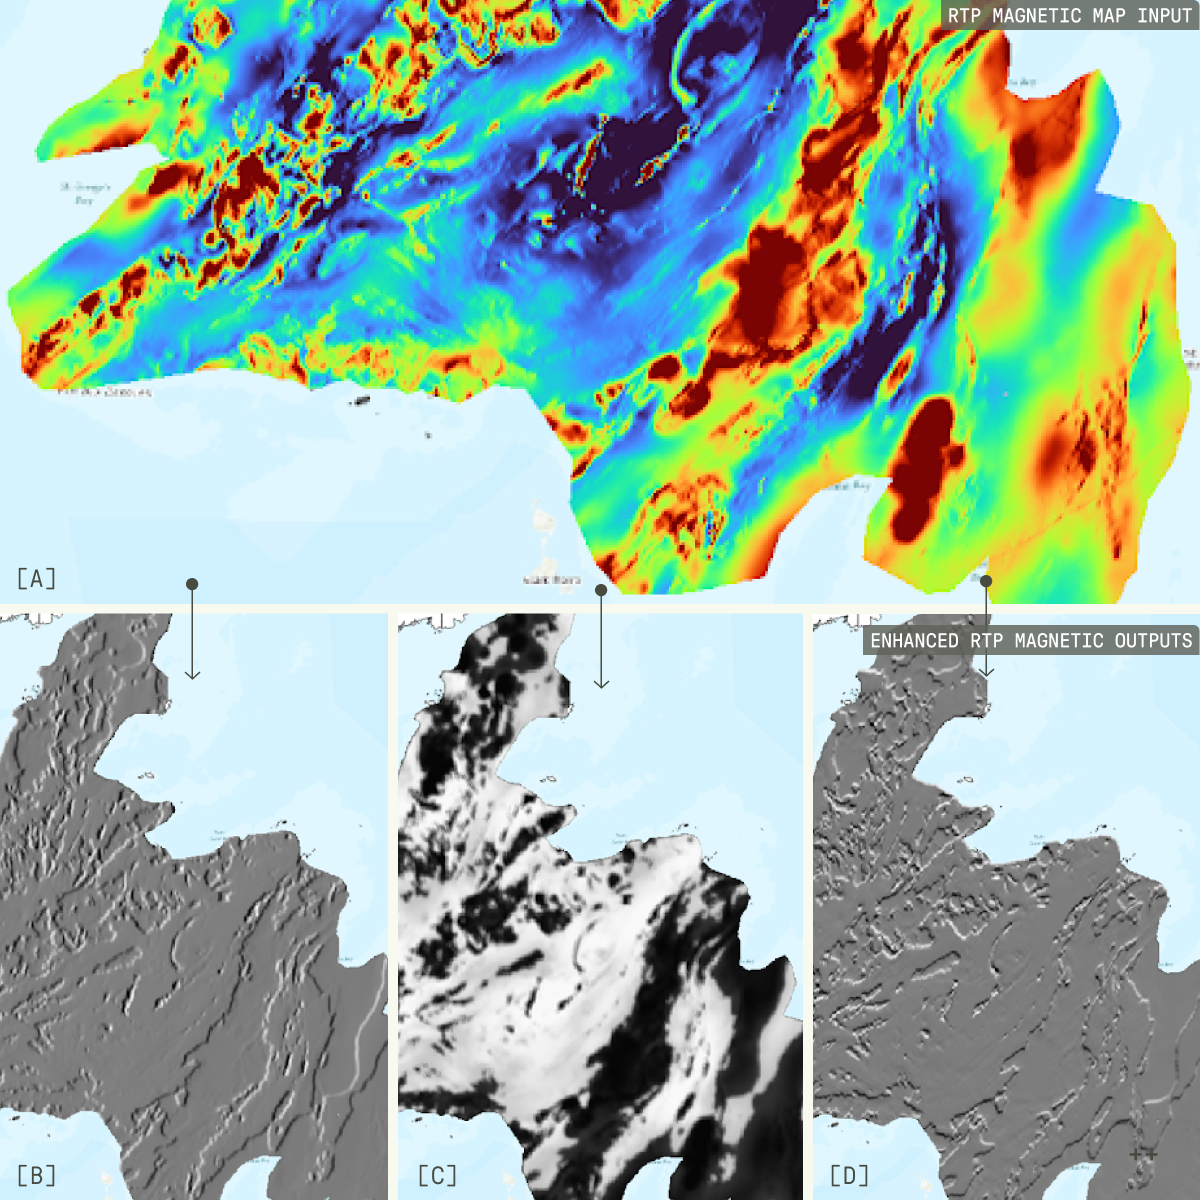
Figure 2. Example of enhancing raster information using the Computer Vision Maps Module. (A) Reduced-to-pole (RTP) magnetic map of the island of Newfoundland, Canada. (B,C,D) Enhanced RTP magnetic map of the island of Newfoundland, Canada. (Input data source: the Geological Survey Division of the Mining and Mineral Development Branch, Government of Newfoundland and Labrador).The Computer Vision Maps Module processes continuous data rasters to extract neighbourhood context. It extracts multiple levels of information that encode local texture and spatial arrangement around each response, allowing measured values to be assessed in relation to their surrounding signature. This context is particularly useful for geophysical rasters, where similar values can occur in different geological settings. By carrying local pattern information into the modelling workflow, the module helps reduce reliance on isolated anomalies and encodes texture and pattern as explicit features the model can use directly.

Generating new data layers

Beyond format transformation and enhancement, Data Augmentation can generate new layers from one or more raster inputs. These derivatives extend what can be evaluated from the source data by applying known spatial or geological patterns across the AOI, including areas where direct measurements are limited.

Derived layers should be introduced to modelling with a specific test in mind. A practical workflow starts with objective datasets that have continuous coverage, after which derived layers can be added progressively when a geological feature or signal needs clearer representation. Comparing model response with and without a derived layer helps show whether its inclusion strengthens the result or adds uncertainty from interpretation-derived information.
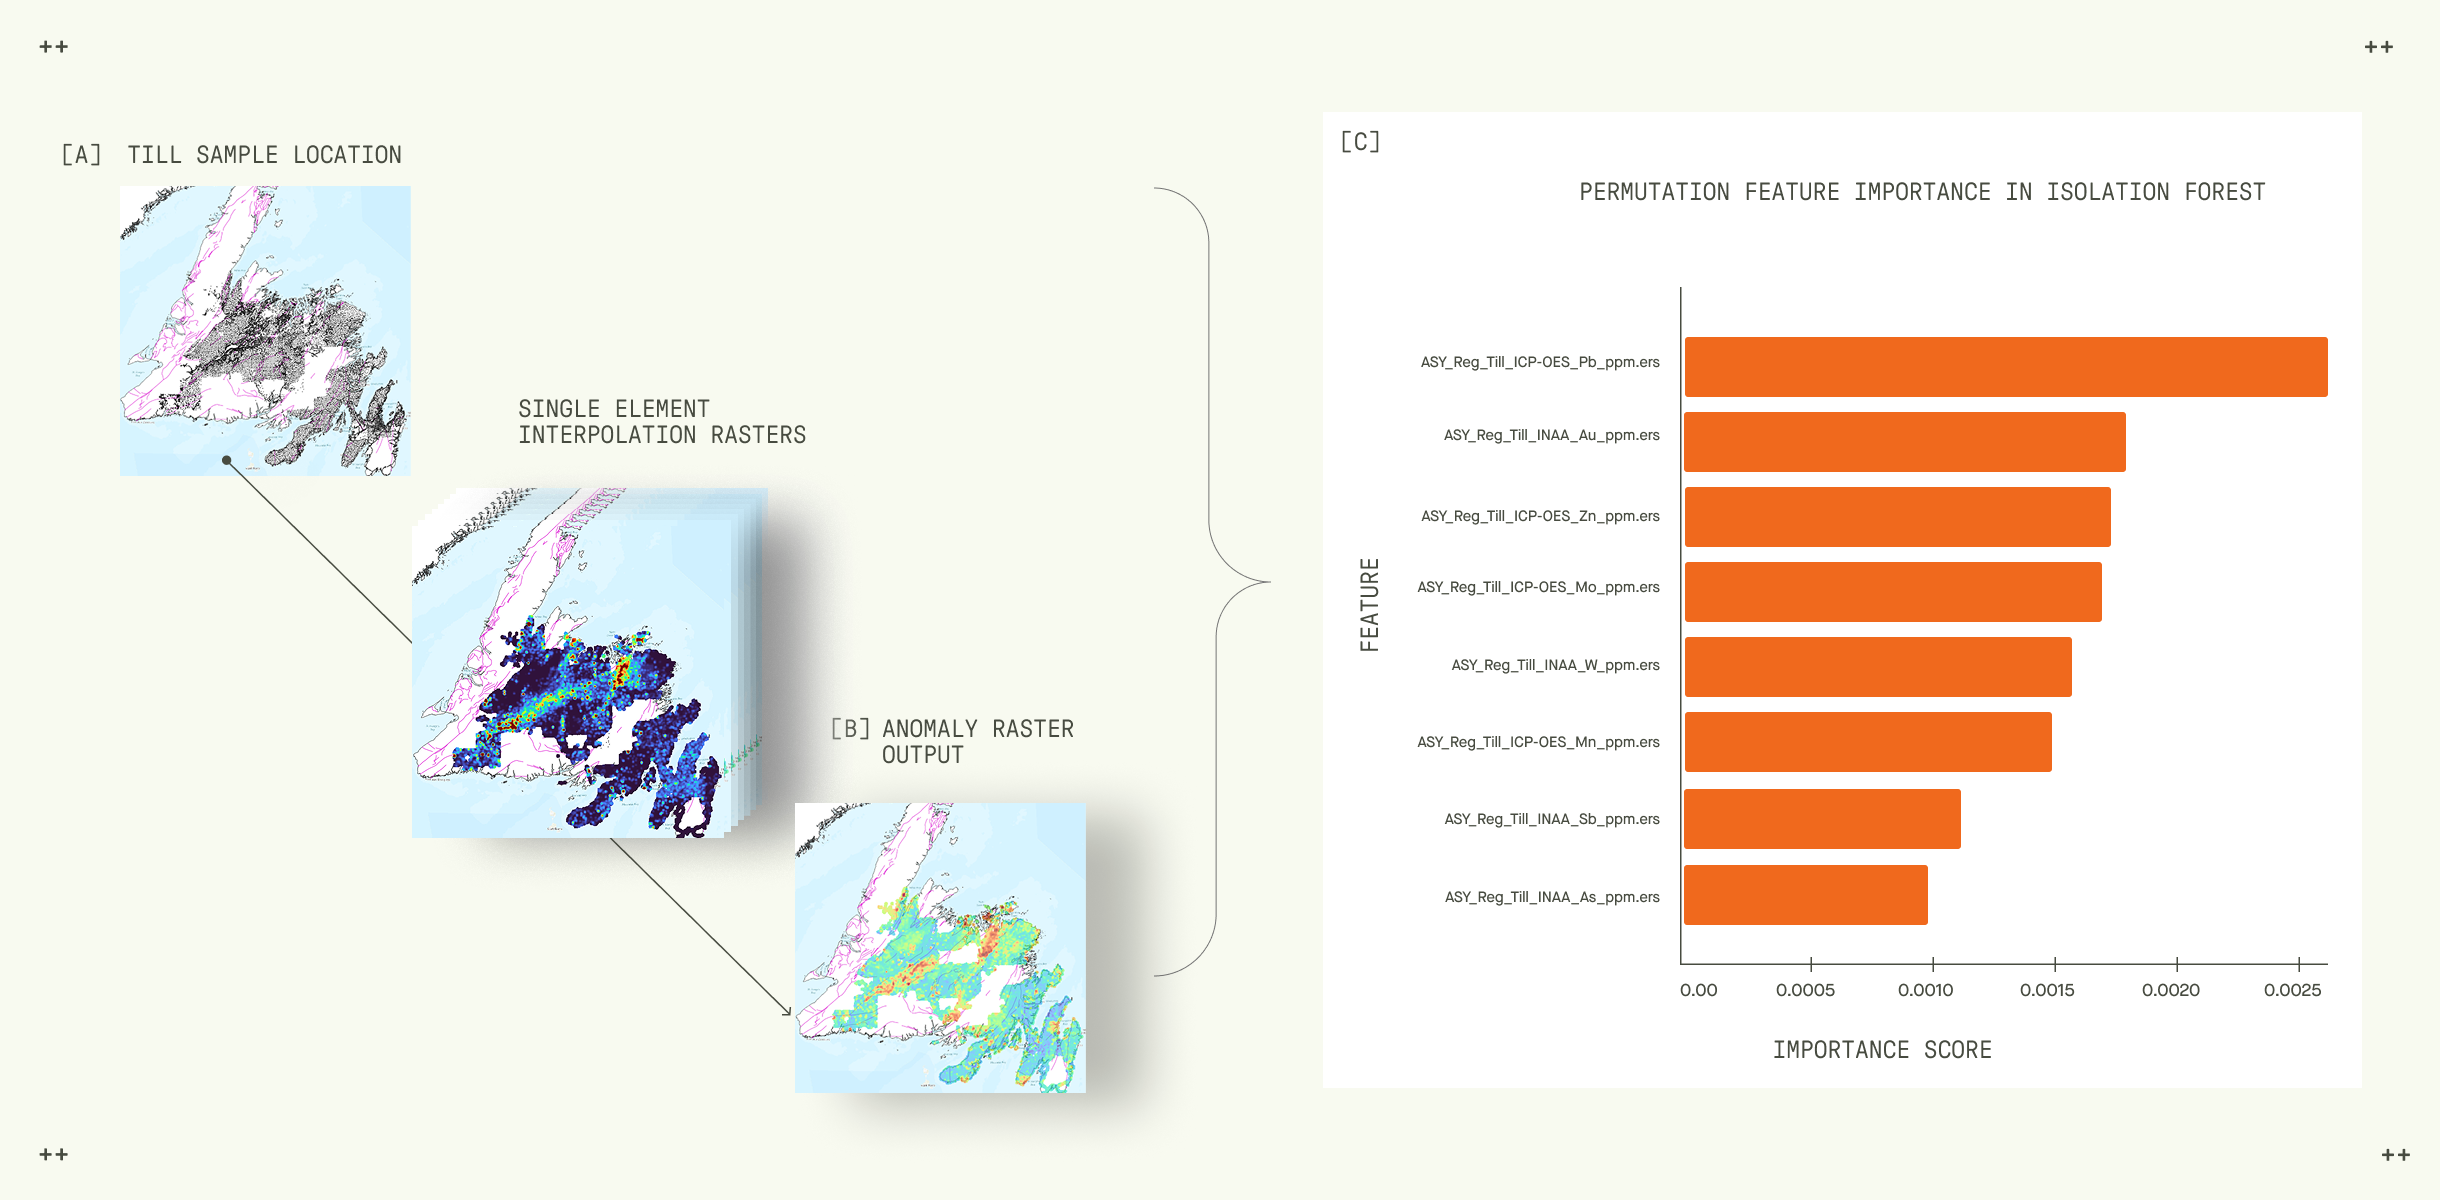
Figure 3. Example of generating a multivariate anomaly raster using the Multivariate Anomaly Maps Module. (A) Till sample locations (black circles), Newfoundland, Canada. (B) Pathfinder element anomaly raster generated from selected geochemical grids based on the till sample data with regional fault structures (purple lines). (C) Feature-importance scores for the input layers used to generate the anomaly raster. Higher values indicate a stronger contribution to the anomaly calculation. (Input data source: the Geological Survey Division of the Mining and Mineral Development Branch, Government of Newfoundland and Labrador)The Multivariate Anomaly Maps Module condenses stacked continuous rasters into a single two-sided anomaly raster. At each grid cell, values from selected input layers are treated as one multivariate observation and evaluated with isolation-forest outlier detection to identify combined signatures that differ from the broader dataset. The anomaly raster is useful in settings with broad alteration halos or overlapping geochemical and geophysical expressions, where a mineralization footprint may be expressed across multiple variables rather than captured by one variable alone.

<hr />

Data Augmentation prepares source inputs for modelling in DORA by rasterizing vector data and enhancing signals present in source rasters. New layers generated through this process can broaden the analytical context, but should be selected according to the deposit concept and the geoscientist’s understanding of local controls on mineralization rather than carried forward by default. As new data is acquired and the project’s geological picture develops, Data Augmentation can be iterated upon to refine the model.

If you would like to learn more about Data Augmentation or DORA, book a demo with our Geoscience Team.

Book A Demo

Discover how the world’s first AI-Assisted Mineral Platform can support your exploration team in making game-changing discoveries.
Book A Demo

Dig further into the full DORA workflow and how its outputs remain interpretable in this article: Transparent AI for Mineral Exploration.
See Vrify in action

start discovering.

Book a Demo